Elasticsearch, Logstash, Kibana Tutorial: Load MySQL Data into Elasticsearch
Elasticsearch, Logstash, Kibana Tutorial: Load MySQL Data into Elasticsearch
Introduction
I was searching for a tutorial online on all the elements of the "Elastic Stack" (formerly the "ELK stack") and all I found was either a tutorial on Elasticsearch only or a tutorial on Logstash only or a tutorial on Kibana only or a data migrate tutorial using Logstash and Elaticsearch. Hence I came up with this tutorial which gives a comprehensive overview of all the elements in the Elastic Stack. The use case that I am using in this post is a data load from MySQL DB into Elasticsearch using Logstash and visualizing this data using Kibana.
Elasticsearch
Elasticsearch is a distributed, RESTful search and analytics engine that is based on Apache Lucene. It provides a distributed, multitenant-capable full-text search engine with an HTTP web interface and schema-free JSON documents.
For more details on Elasticsearch, you can check: Elasticsearch Website.
Logstash
Logstash is an open source, server-side data processing pipeline that ingests data from a multitude of sources simultaneously, transforms it, and then sends it to your favorite “stash.”
For more details on Logstash, you can check: Logstash Website.
Kibana
Kibana is an open source data visualization plugin for Elasticsearch. It provides visualization capabilities on top of the content indexed on an Elasticsearch cluster.
Requirements to Run the Application:
- MySQL Database
- Elasticsearch
- Logstash
- Kibana
Here are the steps required to load and view data in Elasticsearch.
Step 1: Create sample data in MySQL DB
MySQL Database should be setup and running in your machine. To setup, run and test if the MySQL Database is working fine, please refer to my post on: MySQL Database Setup.
In this post, I am using a simple Student Table. Here is the script to create this table in the MySQL Database:
CREATE TABLE STUDENT(
STUDENTID INT NOT NULL AUTO_INCREMENT PRIMARY KEY,
NAME VARCHAR(50),
COURSE VARCHAR(50),
SCORE INT(5)
);
Insert some data in the table Student:
INSERT INTO STUDENT(NAME,COURSE,SCORE) VALUES ('Mark','C001',91);
INSERT INTO STUDENT(NAME,COURSE,SCORE) VALUES ('Jane','C002',88);
INSERT INTO STUDENT(NAME,COURSE,SCORE) VALUES ('Jim','C003',94);
Step 2: Start Elasticsearch
Elasticsearch should be setup and running in your machine. To setup, run and test if Elasticsearch is working fine, please refer to my post on: Elastic Stack Setup.
Here is the command to start Elasticsearch for your reference:
Here is the command to start Elasticsearch for your reference:
D:\Programs\elasticsearch-5.6.3\bin>elasticsearch.bat
Step 3: Setup Logstash Configuration and start Logstash
Using the JDBC plugin available for Logstash, the data from any database with a JDBC interface can be loaded into Logstash as input. The JDBC plugin also supports scheduling for data load in logstash and loading of selective data as input by using queries. In this post I will be showing 2 options to load data.
Option 1: One time data load
JDBC driver for MySQL is required for Logstash to run and execute the data load. I have used the driver: mysql-connector-java-6.0.6.jar. It can be downloaded from: MySQL Website.
The Logstash configuration file has two sections:
Here is the configuration for one time data load:
The Logstash configuration file has two sections:
- input : Describes the input source of the data
- output: Describes the output target or destination of the data
Here is the configuration for one time data load:
input {
    jdbc {
        # MySQL DB jdbc connection string to our database, softwaredevelopercentral
        jdbc_connection_string => "jdbc:mysql://localhost:3306/softwaredevelopercentral?autoReconnect=true&useSSL=false"
        # The user we wish to execute our statement as
        jdbc_user => "root"
        # The user password
        jdbc_password => ""
        # The path to our downloaded jdbc driver
        jdbc_driver_library => "D:\Programs\MySQLJava\mysql-connector-java-6.0.6.jar"
        # The name of the driver class for MySQL DB
        jdbc_driver_class => "com.mysql.cj.jdbc.Driver"
        # our query
        statement => "SELECT * FROM student"
    }
}
output {
    stdout { codec => json_lines }
    elasticsearch {
       hosts => ["localhost:9200"]
       index => "students"
       document_type => "student"
       document_id => "%{studentid}"
       }
}
jdbc_connection_string: I have named the database in MySQL DB as softwaredevelopercentral
The data that I am loading in this post is student data. Hence in the output section I have used the following:
- index: Describes the data collection. I have named it as students.
- document_type: Describes each element of the collection. I have named it as student.
- document_id: To maintain unique record for each student I have mapped the document_id to studentid column in MySQL. If this is not mentioned then each load will reload the same data over and over and we will end up with duplicates in Elasticsearch.
Option 2: Scheduling data load and Incremental Update of data
Here is the configuration (logstash-mysql.conf) for scheduling data load and incremental update of data:
input {
    jdbc {
        # MySQL DB jdbc connection string to our database, softwaredevelopercentral
        jdbc_connection_string => "jdbc:mysql://localhost:3306/softwaredevelopercentral?autoReconnect=true&useSSL=false"
        # The user we wish to execute our statement as
        jdbc_user => "root"
        # The user password
        jdbc_password => ""
        # The path to our downloaded jdbc driver
        jdbc_driver_library => "D:\Programs\MySQLJava\mysql-connector-java-6.0.6.jar"
        # The name of the driver class for MySQL DB
        jdbc_driver_class => "com.mysql.cj.jdbc.Driver"
        # our query
        schedule => "* * * * *"
        statement => "SELECT * FROM student WHERE studentid > :sql_last_value order by studentid"
        use_column_value => true
        tracking_column => "studentid"
    }
}
output {
    stdout { codec => json_lines }
    elasticsearch {
       hosts => ["localhost:9200"]
       index => "students"
       document_type => "student"
       document_id => "%{studentid}"
       }
}
- schedule: This scheduling syntax is powered by rufus-scheduler. Documentation of this syntax can be found here. The syntax I have used above ("* * * * *") runs Logstash at an interval of one minute.
- statement: Defines the SQL that runs when the scheduler triggers Logstash.
- sql_last_value: It is used to calculate which rows to query. It is updated after every run of Logstash as per scheduler syntax if use_column_value is set to true and tracking_column is set.
- use_column_value: Setting for updating sql_last_value.
- tracking_column: Column to be tracked for updating sql_last_value.
Start Logstash:
Here is the command to start Logstash:D:\Programs\logstash-5.6.3\bin>logstash -f logstash-mysql.conf
Step 4: Start Kibana
Kibana should be setup and running in your machine. To setup, run and test if Kibana is working fine, please refer to my post on: Elastic Stack Setup.
Here is the command to start Kibana for yout reference:
Open the following URL in your browser:D:\Programs\kibana-5.6.3-windows-x86\bin>kibana.bat
http://localhost:5601
You will see the following page:
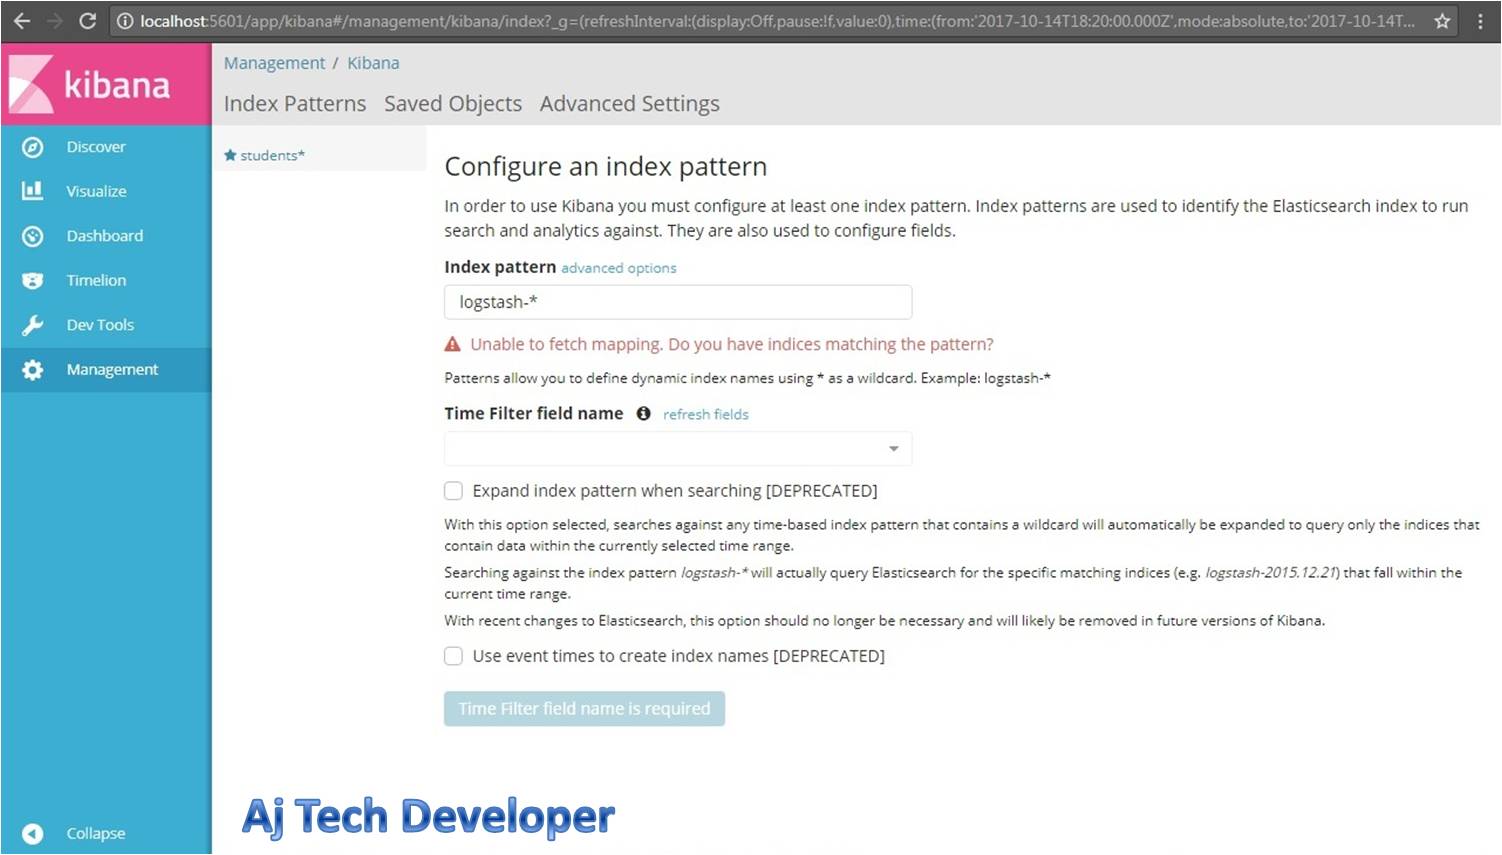
If you observe the Logstash configuration above, we are using the index: students. So we need to add this index in Kibana to view the data loaded into Elasticsearch. Then click on the Create button.


INSERT INTO STUDENT(NAME,COURSE,SCORE) VALUES ('John','C001',89);
As the scheduler is running every minute, it will load this single row of data into Elasticsearch and then in Kibana, if you filter by the time the data was loaded you will see that this data was loaded.
Access data in Elasticsearch by using REST APIs:
Elasticsearch runs on the default port 9200.
1. POST API to run the most basic query on Elasticsearch to fetch all data
JSON Request Body:1. POST API to run the most basic query on Elasticsearch to fetch all data
  {
   "query": {
     "match_all":{}
     }
  }
http://localhost:9200/students/_search
JSON Request Body:
  {
   "query": {
     "match_all":{}
     }
  }
3. GET API to get student by IDhttp://localhost:9200/students/student/1
4. DELETE API to delete student by ID
http://localhost:9200/students/student/1
5. POST API to delete all the data with the index: students and type: student
http://localhost:9200/students/student/_delete_by_query
JSON Request Body:
  {
   "query": {
     "match_all":{}
     }
  }
Conclusion:
In this post I have given a comprehensive overview of the use case to load data from a relational database (MySQL DB) into Elasticsearch using Logstash and visualization of this data using Kibana and REST APIs. This covers all the 3 elements of the Elastic Stack.
Learn the most popular and trending technologies like Blockchain, Cryptocurrency, Machine Learning, Chatbots, Internet of Things (IoT), Big Data Processing, Elastic Stack, React, Progressive Web Application (PWA), Angular 5, GraphQL, Akka HTTP, Play Framework, Dropwizard, Docker, Netflix Eureka, Netflix Zuul, Spring Cloud, Spring Boot, Flask and RESTful Web Service integration with MongoDB, Kafka, Redis, Aerospike, MySQL DB in simple steps by reading my most popular blog posts at Software Developer Central.
If you like my post, please feel free to share it using the share button just below this paragraph or next to the heading of the post. You can also tweet with #SoftwareDeveloperCentral on Twitter. To get a notification on my latest posts or to keep the conversation going, you can follow me on Twitter or Instagram. Please leave a note below if you have any questions or comments.

The content is good and very informative and I personally thank you for sharing article on Elasticsearch.
ReplyDeleteHi @Sarika
DeleteThanks for your comment.
input
ReplyDelete{
jdbc{
jdbc_connection_string => " "
jdbc_user => "temos"
jdbc_password => " "
jdbc_driver_library => "F:/logstash-6.3.0/bin/ojdbc6.jar"
jdbc_driver_class => "Java::oracle.jdbc.driver.OracleDriver"
statement=>"Select trnref from TANSACTION_IDS where trnref >
:sql_last_value order by trnref"
use_column_value => true
tracking_column => "trnref"
}
}
output
{
elasticsearch{
index=>"transfernew"
document_type=>"trans"
document_id=>"%{trnref}"
hosts=>"localhost"
}
}
The above code is always giving value 0 in sql_last_value. I have tried everything even deleted the .logstash_last_run file many times but still the value of sql_last_value is 0 on running the conf file mant times.What is the issue?Please help
Hi @Anant
DeleteIf you are using tracking_column and doing an incremental update of data then use schedule. If you observe in my post, I am using:
schedule => "* * * * *"
This runs Logstash at an interval of one minute.